Reflection
Throughout this project, our team as a whole honed our skills in the iterative process of design and the overall process of user research, particularly in the context of new product development. If we were give more time on this project, we would conductmore in-depth research for a data-driven approach to design. Conducting more user interviews, usability testings, and A/B testing on our primary wireframes would help us further to get a better understanding of the user needs and create more flow accordingly.
Usability Testing
After going through more and more interactions, we drafted the plan for the usability test with three main tasks for the user to complete.
First impression
Set new steps in the Tracking page
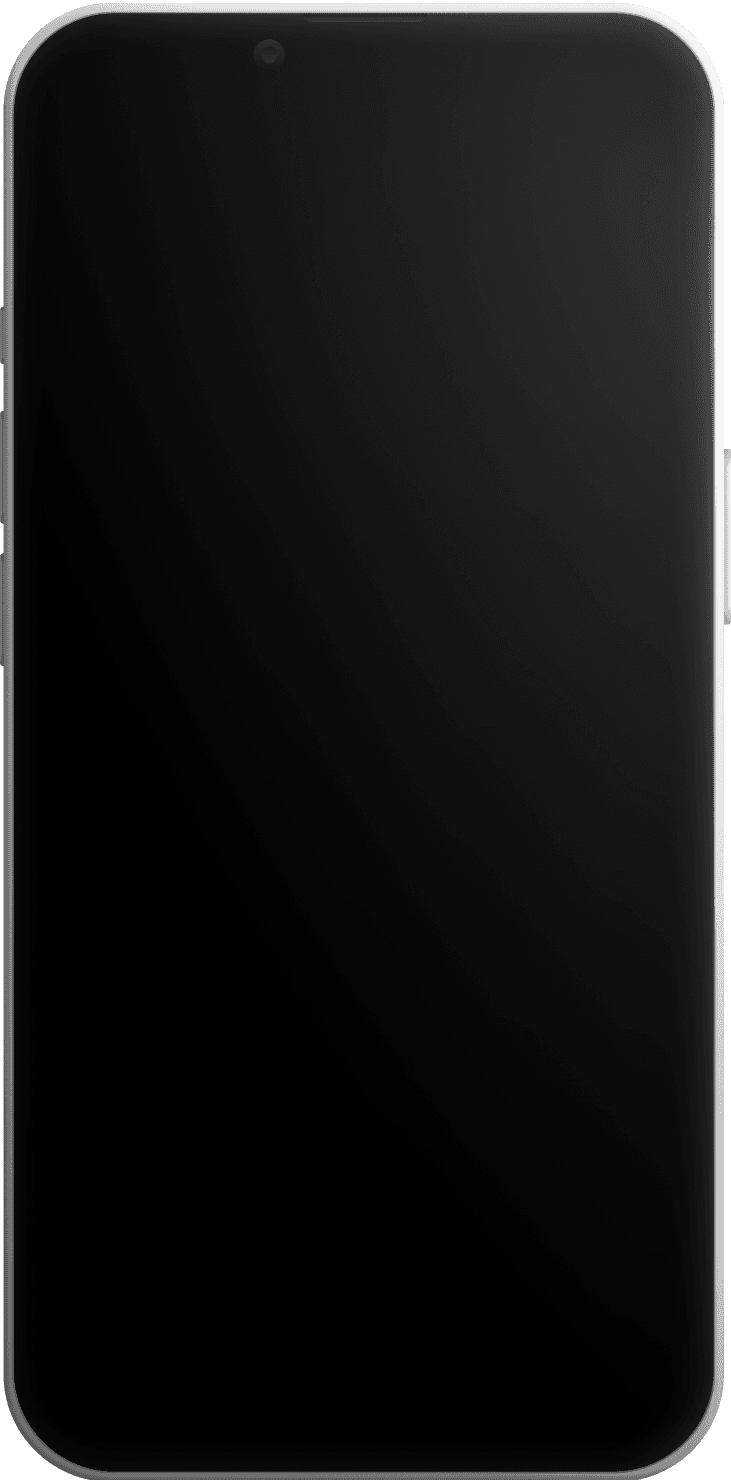
Find the News article
We performed a series of usability tests with these three tasks in mind. Some were conducted live in person and others virtually, prompting users to articulate each interaction and thought process. This approach aimed to comprehensively grasp areas for enhancement and refine our understanding of user experiences.
We repeated these steps, user after user after user…
→ As a result, we found three main issues through the testing:
Icon Issues
Some icons were misleading or too small.
Lack of Guide
Some users were confused about the functionality of some features of the app and wanted to get more information on what each page meant.
Overcomplication
Certain pages required excessive steps for access, notably the Tracking Settings page—an integral component of the app's core functionality, yet difficult to locate. Users misinterpreted the purpose of the "Update" button, assuming it was meant for adjusting Tracking Settings (though it was made to update their daily progress).
UX/UI Designer
Frances Chen
Ben Cox
Figma
FigJam
UX/UI Design
User Research
Wireframe & Prototyping
Visual Design
Product Strategy
ROLE
TEAM
TOOLS
SKILLS
Social Media Platform for Climate Responsibility
Social Media Platform for Climate Responsibility
FOOTPRINT
As the lead designer, I defined the project's product identity and strategy, crafted numerous wireframes, and overhauled the design systems for a more cohesive and efficient approach.
Under the guidance of current Principal and Senior Interaction Designers at Red Hat, I worked on this project as a team of 3 to ideate, design, and create an application to slow the effects of climate change by tracking personal energy consumption.
How can we encourage climate responsibility by tracking personal energy consumption?
Project Overview
To address the challenge of limited awareness and actionable steps in combating climate change driven by fossil fuel consumption, our team was tasked with developing a product focused on tracking personal energy usage (carbon footprint) providing tailored recommendations for reducing individual consumption, and fostering climate responsibility at a grassroots level.
The Problem
After a thorough discussion, our team decided on these two problems as the main goals to solve:
Users feel like they’re not making a real impact
Apps on the market are not interactive and don’t offer a call-to-action
SOLUTION
To design an application that solves our two main problems, we decided to make an interactive social media platform that (1) uses numbers to quantify user’s impact and (2) offers resources that provide a guide and lead to an environmentally friendly lifestyle.
TL;DR = “making sustainability fun”
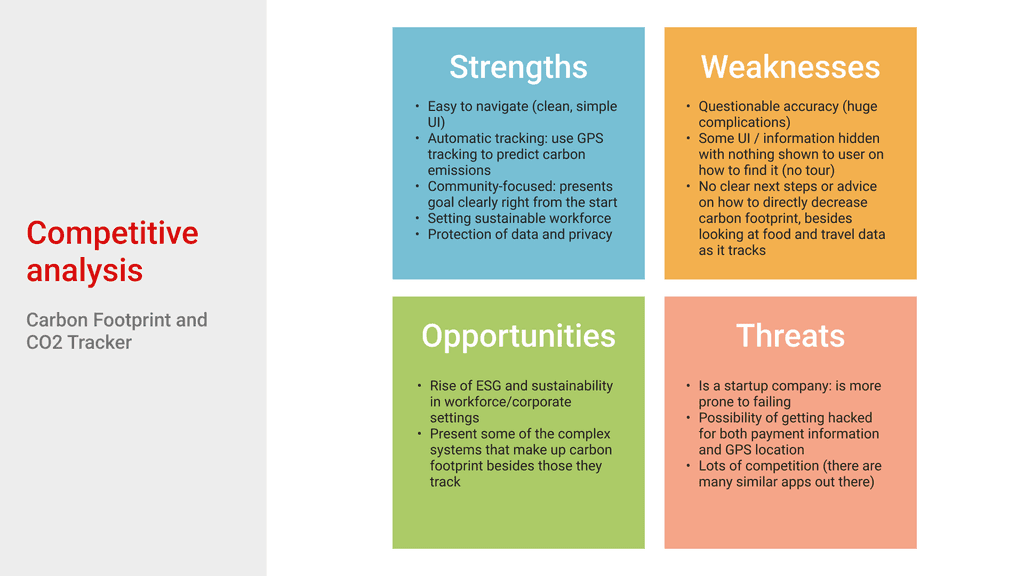
Our team selected the two most commonly used carbon footprint apps and conducted a SWOT (Strengths, Weaknesses, Opportunities, Threats) analysis on both of the platforms.
→ As a result, we learned that both our competitors had template-like designs and interactions. It didn’t offer any customization options for the users and didn’t have any way for the user to see the impact they’ve made. It almost felt like there wasn’t a purpose for using these apps.
Competitor Analysis
& User Interview
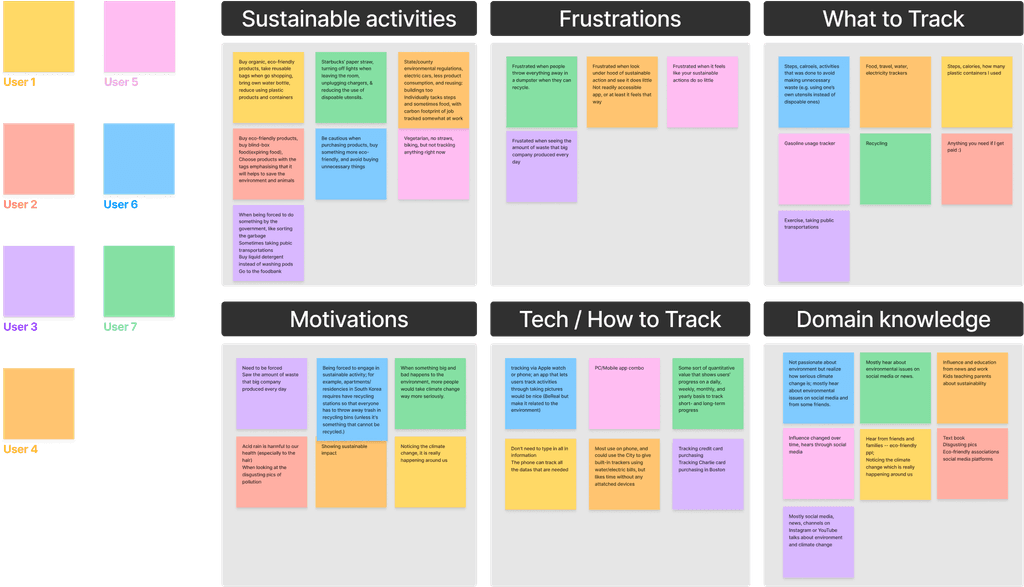
From the insight we learned through SWOT analysis, we conducted user interviews to gather qualitative responses from our potential users to get a better understanding of the user’s needs before we dive into user persona and journey mapping.
→ Users were profoundly driven by witnessing tangible impacts. Their motivation to take on sustainable actions thrived on observing real changes. Conversely, witnessing others disregard the environment and discard them carelessly, demotivated them. They felt that no matter what they did, their efforts didn’t make a difference in such an environment.
User Persona &
Journey Mapping
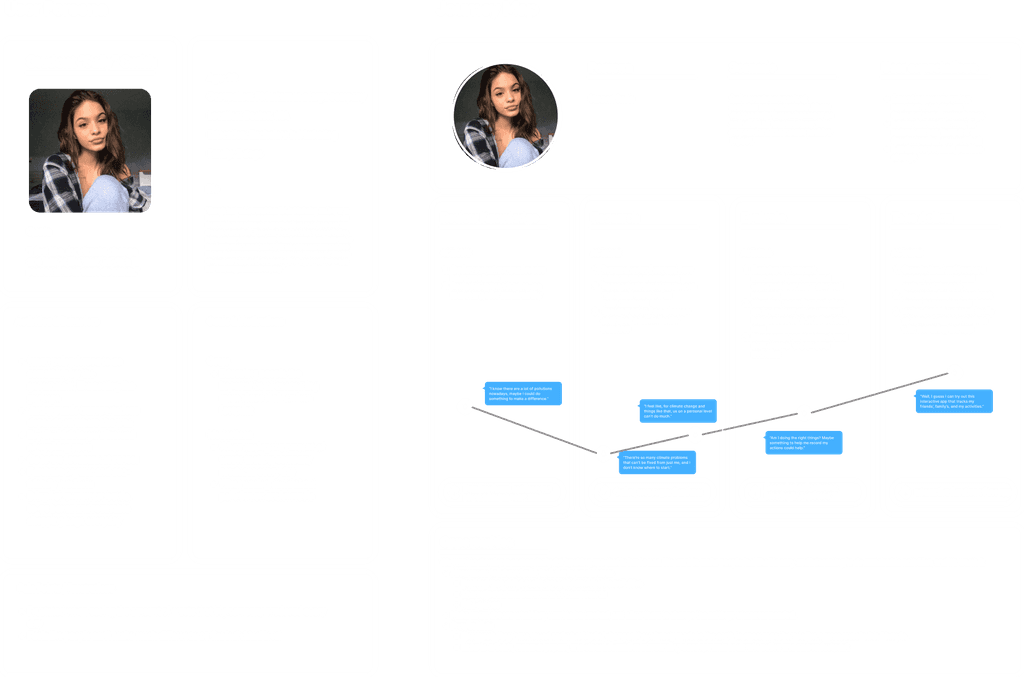
Based on our research, we created a persona named Student “Sally” Smith, a female in her 20s, hoping that more people will understand the importance of being more concerned about the carbon footprint. Her motivation would be impacted by seeing the amount of waste that big company produces every day and seeing news about pollution on social media.
Low-Fidelity
Wireframe
We started designing the skeleton of our product with three main changes: Home, Ranking, and News.
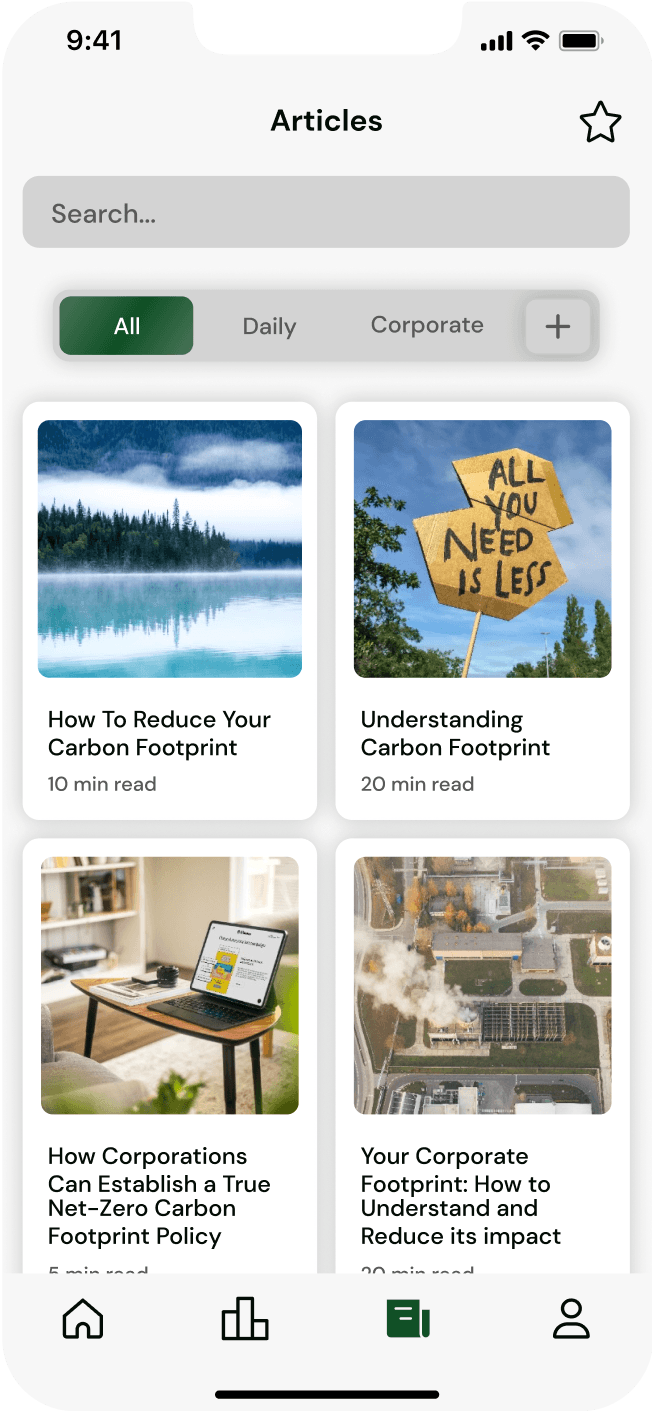
Home page features the user’s daily tracking and their friend’s progress
Ranking page features user ranking with filter options (by “Global,” “Friends,” and “Work)
In creating these wireframes, we wanted to make sure that they were intuitive and easy to use, so we took inspiration from popular social media platforms like BeReal, Snapchat, and other tracking apps that are currently on the IOS app store.

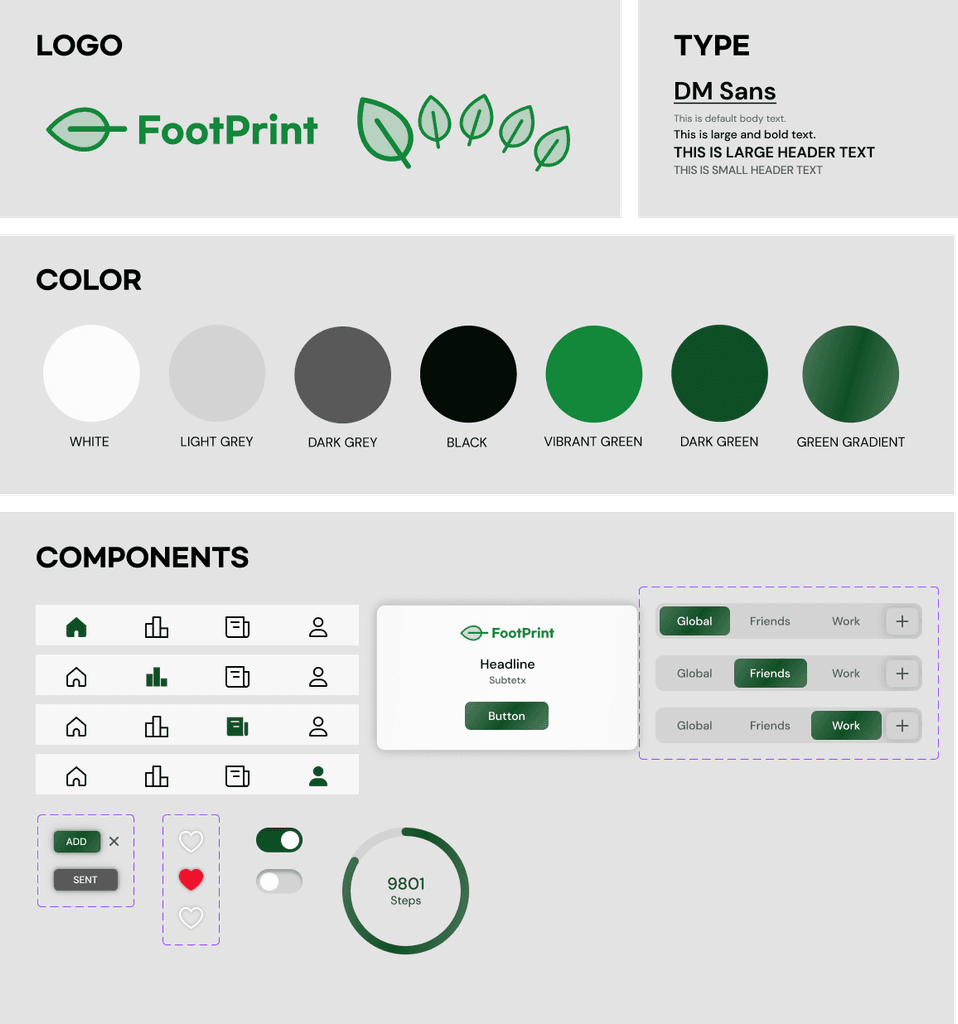
Establishing
Style Guide
♻️ Green = nature & environment
Using this intuitive association, we selected a palette of green colors as accent colors and created our logo with leaf icons in the shape of a foot (to symbolize carbon footprint).
The Visual Identity:
High-Fidelity
Wireframe
Once we decided on the colors, typography, and other elements, it was time to add them to our low-fidelity wireframes!
However, we noticed that our flow was lacking in one of the goals we established earlier in the project–interactivity. We realized we had to add more differentiating characteristics to set us apart from our competitors.
→ We created daily action items for the user:
Users now have to take a photo to track their progress and view their friends’ progress
Increased interaction options between users (commenting, liking, sharing, etc.))

Revised High-Fidelity Wireframe

Final Product
During our final revision stage, we also added a feature of measuring the user's quantitative impact on the environment by "-Footprint." Finally, we finished our final product and were ready to present our work! Below is the recording of the final product.